What is UML?
In this UML tutorial we will discover together the Unified Modeling Language or UML. It’s a standardized graphical language developed by the Object Management Group (OMG) to visualize, specify, communicate, construct, and document software systems. First introduced in January 1997 with version 1.0, this tutorial focuses on UML version 2.5.1, which comprises 14 diagrams categorized into two main types.
Types of UML Diagrams
Structural Diagrams
Structural diagrams depict the static architecture of a system’s objects irrespective of time. They represent the significant concepts within a system and can include abstract ideas, real-world entities, and implementation details. While structural diagrams don’t illustrate dynamic behaviours, they may indicate relationships with the behaviours of classifiers within the diagrams.
Behavioural Diagrams
Behavioural diagrams capture the dynamic interactions and behaviours of a system’s objects, including methods, collaborations, activities, and state changes. Interaction diagrams, which are a subset of behavioural diagrams, focus on the communication between objects within a system. They provide a detailed view of how objects interact through message exchanges over time. This makes them crucial for modeling and understanding use cases, workflows, and functional requirements.
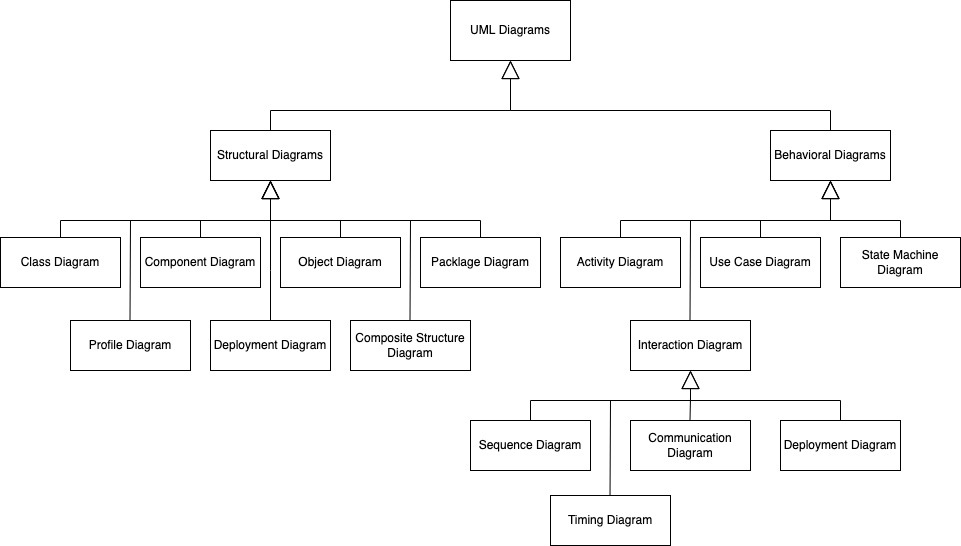
Taxonomy of UML Diagrams
In order to better understand the organization and categorization of UML diagrams, the following illustration provides a visual representation of the types of UML diagrams.
Why UML ?
UML provides a standardized visual language for representing software systems, helping developers, architects, and stakeholders communicate clearly.
Beyond documentation, UML actively supports designing, developing, and maintaining software. It offers teams:
- Clear Visualization – Converts abstract ideas into structured diagrams showing components and relationships at a glance.
- Better Communication – Serves as a common language across developers, analysts, and managers.
- Early Problem Detection – Identifies design flaws before coding begins.
- Living Documentation – Evolves with the project, easing onboarding and maintenance.
- Agile Support – Adapts to lightweight, iterative workflows.
UML Structural Diagrams
UML structural diagrams represent the static aspects of a system. They focus on system’s architecture, relationships between objects and component composition. They are very useful in software design, documentation and analyses.
Compared to behavioral diagrams, structural diagrams describe components of a system, while behavioral diagrams show the interaction between these components. For example, a class diagram defines objects and their attributes. A sequence diagram, on the other hand, focuses more on the interactions between objects over time.
In UML 2.5, there are 7 types of structural diagrams. I will cover them in the following paragraphs
Class Diagram
Class diagrams are the backbone of object-oriented modeling. They show the structure of a system by displaying classes, their attributes, methods, and the relationships between them.
Key Elements:
- Classes – Represented as rectangles divided into three sections: class name, attributes, and methods
- Attributes – Properties or data members of a class
- Methods – Functions or operations that a class can perform
- Relationships – Associations, inheritance, aggregation, composition, and dependencies between classes
When to Use Class Diagrams:
Class diagrams are essential during the design phase when you need to map out the structure of your application. They’re particularly useful for database design, API development, and communicating system architecture to stakeholders.
Visibility Modifiers:
+Public – accessible from anywhere-Private – accessible only within the class#Protected – accessible within the class and its subclasses~Package – accessible within the same package
Relationship Types:
- Association – A general relationship between two classes (solid line)
- Inheritance – “Is-a” relationship where a child class inherits from a parent (solid line with hollow arrow)
- Aggregation – “Has-a” relationship where the child can exist independently (solid line with hollow diamond)
- Composition – Strong “has-a” relationship where the child cannot exist without the parent (solid line with filled diamond)
- Dependency – One class uses another temporarily (dashed line with arrow)
Practical Example:
Consider an e-commerce system. You’d have classes like Customer, Order, Product, and ShoppingCart. A Customer can place multiple Orders (one-to-many association). An Order contains multiple Products (aggregation). The diagram would clearly show these relationships and help developers understand the system structure before coding.
Object Diagram
Object diagrams are similar to class diagrams but focus on instances of classes at a specific point in time. They show actual objects (instances) and their relationships, providing a snapshot of the system’s state.
Key Differences from Class Diagrams:
- Object diagrams show instances, not class definitions
- They display actual values of attributes
- They represent the system at a particular moment
- Object names are underlined
When to Use Object Diagrams:
Object diagrams are helpful when you need to:
- Demonstrate example scenarios or test cases
- Show complex data structures with actual data
- Debug or explain specific system states
- Validate class diagram relationships with concrete examples
Practical Example:
For an online store, instead of showing a generic “Customer” class, an object diagram would show specific customers like “john_smith:Customer” with actual values like email=”[email protected]” and membershipLevel=”Gold”.
Component Diagram
Component diagrams illustrate the organization and dependencies among software components. They show how different parts of a system are wired together to form the complete application.
Key Elements:
- Components – Modular parts of the system represented as rectangles with a component icon
- Interfaces – Points of interaction shown as circles (provided) or half-circles (required)
- Dependencies – Dashed arrows showing which components depend on others
- Ports – Interaction points on components
When to Use Component Diagrams:
Component diagrams are valuable for:
- Visualizing the high-level architecture of large systems
- Planning microservices architecture
- Understanding third-party library dependencies
- Documenting plugin or module-based systems
Practical Example:
A web application might include components like “Authentication Service”, “Database Layer”, “REST API”, and “Frontend Application”. The diagram would show how the REST API depends on the Authentication Service and Database Layer, while the Frontend depends on the REST API.
Deployment Diagram
Deployment diagrams show the physical architecture of a system, including hardware, software, and how they’re connected. They map software components to the infrastructure that runs them.
Key Elements:
- Nodes – Physical or virtual hardware represented as 3D boxes
- Artifacts – Software files, executables, or libraries
- Communication Paths – Connections between nodes
- Deployment Specifications – Details about how artifacts are deployed
When to Use Deployment Diagrams:
These diagrams are essential for:
- Planning infrastructure and DevOps setup
- Documenting production environments
- Understanding network topology
- Planning cloud architecture and scaling
Practical Example:
A typical three-tier web application deployment would show a web server node running Nginx, an application server node running your backend service, and a database server node running PostgreSQL. Communication paths would show HTTP requests between the web server and app server, and database connections between the app server and database.
Package Diagram
Package diagrams organize model elements into groups (packages) and show dependencies between these groups. They help manage complexity in large systems by creating logical groupings.
Key Elements:
- Packages – Folders or namespaces containing related elements
- Dependencies – Dashed arrows showing which packages depend on others
- Import/Access – Different types of dependencies between packages
- Nested Packages – Packages within packages for hierarchical organization
When to Use Package Diagrams:
Package diagrams are useful for:
- Organizing large systems into manageable modules
- Planning project structure and folder organization
- Understanding code dependencies and potential circular references
- Refactoring and improving system architecture
Practical Example:
In a Java enterprise application, you might have packages like com.company.ui, com.company.business, and com.company.data. The package diagram would show that the UI package depends on the business package, which in turn depends on the data package, preventing inappropriate dependencies.
Composite Structure Diagram
Composite structure diagrams show the internal structure of a class and the collaborations that this structure enables. They reveal the internal parts of a classifier and how they work together.
Key Elements:
- Parts – Internal components of a class
- Ports – Interaction points between parts and the outside world
- Connectors – Links between parts showing communication
- Collaborations – How parts work together to achieve functionality
When to Use Composite Structure Diagrams:
These diagrams are helpful when:
- Designing complex classes with multiple internal components
- Modeling embedded systems or hardware-software interactions
- Showing runtime architecture and collaborations
- Detailing how design patterns are implemented
Practical Example:
For a car management system, a composite structure diagram of the Car class might show internal parts like Engine, Transmission, and Wheels, with ports showing how the driver interacts with the car through the steering wheel and pedals, and connectors showing how the engine powers the transmission.
Profile Diagram
Profile diagrams extend UML to create custom stereotypes, tagged values, and constraints for specific domains or platforms. They allow you to adapt UML to your specific needs.
Key Elements:
- Stereotypes – Custom extensions to UML elements (shown with
<<stereotype>>) - Tagged Values – Additional properties attached to elements
- Constraints – Rules and restrictions on elements
- Extensions – How standard UML elements are extended
When to Use Profile Diagrams:
Profile diagrams are valuable for:
- Creating domain-specific modeling languages
- Extending UML for specific platforms (Java, .NET, cloud platforms)
- Adding metadata to standard UML elements
- Defining coding standards and conventions
Practical Example:
A web development profile might include stereotypes like <<Controller>>, <<Service>>, and <<Repository>> for Spring Framework applications, with tagged values for HTTP methods, request mappings, and transaction settings.
UML Behavioral Diagrams
Behavioral diagrams focus on the dynamic aspects of a system. They show how objects interact, how the system responds to events, and how processes flow through time. While structural diagrams answer “what the system is”, behavioral diagrams answer “what the system does”. In UML 2.5, there are 7 types of behavioral diagrams that I will cover in the following.
Use Case Diagram
Use case diagrams capture the functional requirements of a system from a user’s perspective. They show what the system should do without specifying how it does it.
Key Elements:
- Actors – Users or external systems represented as stick figures
- Use Cases – Functions or services shown as ovals
- Relationships – Include, extend, and generalization relationships
- System Boundary – Rectangle defining the scope of the system
Relationship Types:
- Include – One use case always includes another (dashed arrow with
<<include>>) - Extend – One use case optionally extends another (dashed arrow with
<<extend>>) - Generalization – Inheritance between actors or use cases (solid line with hollow arrow)
When to Use Use Case Diagrams:
Use case diagrams are essential during:
- Requirements gathering and analysis
- Communicating with non-technical stakeholders
- Defining system scope and boundaries
- Planning test scenarios
Practical Example:
For an ATM system, actors include Customer and Bank. Use cases include Withdraw Cash, Check Balance, and Deposit Money. The Withdraw Cash use case would include Authenticate User, and might extend to Print Receipt.
Activity Diagram
Activity diagrams model workflows and business processes. They show the flow of control from activity to activity, including decisions, parallel processing, and synchronization.
Key Elements:
- Activities – Actions or tasks shown as rounded rectangles
- Decision Nodes – Diamond shapes for conditional logic
- Fork/Join Nodes – Thick bars for parallel execution
- Start/End Nodes – Filled circle (start) and circle with border (end)
- Swimlanes – Vertical or horizontal partitions showing responsibility
When to Use Activity Diagrams:
Activity diagrams excel at:
- Documenting business processes
- Modeling complex algorithms
- Showing parallel processing
- Defining workflows in enterprise systems
Practical Example:
An order fulfillment process might start with Receive Order, then fork into parallel activities: Process Payment and Check Inventory. After joining, it proceeds to Ship Order, with decision nodes handling cases like payment failure or out-of-stock items.
State Machine Diagram
State machine diagrams (or state diagrams) show how an object changes states in response to events. They’re crucial for modeling objects with distinct lifecycles.
Key Elements:
- States – Rounded rectangles representing conditions of an object
- Transitions – Arrows showing state changes
- Events – Triggers that cause transitions
- Guards – Conditions that must be met for transitions
- Actions – Activities performed during transitions or within states
When to Use State Machine Diagrams:
State machine diagrams are perfect for:
- Modeling object lifecycles with clear states
- Designing UI components and screens
- Implementing protocol handlers
- Documenting business process states
Practical Example:
A document management system would have states like Draft, Under Review, Approved, and Published. Events like submit(), approve(), or reject() trigger transitions between states, with guards checking permissions or validation rules.
Sequence Diagram
Sequence diagrams show how objects interact over time through message exchanges. They’re one of the most popular UML diagrams for understanding system behavior.
Key Elements:
- Lifelines – Vertical dashed lines representing objects
- Activation Boxes – Thin rectangles showing when an object is active
- Messages – Arrows showing communication between objects
- Return Messages – Dashed arrows showing responses
- Fragments – Boxes for loops, conditions, and alternatives
Message Types:
- Synchronous – Solid arrow with filled head (caller waits for response)
- Asynchronous – Solid arrow with line head (caller doesn’t wait)
- Return – Dashed arrow
- Create – Solid arrow with
<<create>>stereotype - Destroy – Solid arrow to X mark
When to Use Sequence Diagrams:
Sequence diagrams are ideal for:
- Designing API interactions
- Understanding complex workflows
- Documenting microservices communication
- Planning real-time system behavior
Practical Example:
A user authentication sequence would show the User sending credentials to the UI, which calls the Authentication Service, which queries the Database, and returns success or failure through the same chain.
Communication Diagram
Communication diagrams (formerly collaboration diagrams) show interactions between objects with emphasis on the relationships rather than the time sequence. They display the same information as sequence diagrams but with a different focus.
Key Elements:
- Objects – Rectangles representing participants
- Links – Lines showing relationships
- Messages – Arrows with sequence numbers
- Multiplicities – Numbers showing how many instances participate
When to Use Communication Diagrams:
Communication diagrams work well when:
- Focusing on object relationships rather than timing
- Space is limited and you need a compact representation
- You want to show the overall collaboration pattern
- The sequence of events is less important than the structure
Practical Example:
In a shopping cart system, you’d see Customer, ShoppingCart, and Product objects connected by links, with numbered messages like “1: addItem()”, “2: checkAvailability()”, “3: updateTotal()” showing the interaction flow.
Timing Diagram
Timing diagrams show how objects change state over time on a linear time scale. They’re specialized diagrams for time-critical systems.
Key Elements:
- Lifelines – Horizontal or vertical lines representing objects
- States – Different conditions shown as horizontal bands
- State Changes – Transitions marked at specific times
- Time Constraints – Duration and timing requirements
- Events – Triggers shown at specific time points
When to Use Timing Diagrams:
Timing diagrams are essential for:
- Real-time and embedded systems
- Hardware-software co-design
- Protocol specification
- Performance analysis
Practical Example:
A traffic light controller timing diagram would show how lights transition from Green to Yellow to Red with precise timing (e.g., Green for 30 seconds, Yellow for 5 seconds, Red for 35 seconds), synchronized with pedestrian crossing signals.
Interaction Overview Diagram
Interaction overview diagrams combine activity diagrams with interaction diagrams. They show a flow of control where nodes can be interaction diagrams (sequence, communication, or timing diagrams).
Key Elements:
- Activity Nodes – Rounded rectangles containing interactions
- Decision Nodes – Diamonds for branching logic
- Fork/Join Nodes – Bars for parallel flows
- Inline Interactions – Small sequence or communication diagrams
- Interaction References – References to separate interaction diagrams
When to Use Interaction Overview Diagrams:
These diagrams are valuable for:
- Showing multiple scenarios in one diagram
- Combining high-level flow with detailed interactions
- Documenting complex use cases with variations
- Providing an overview of system behavior with drill-down details
Practical Example:
An e-commerce checkout process overview would show decision points for payment methods, with inline sequence diagrams showing credit card processing, PayPal flow, and order confirmation sequences, all connected in a logical flow.
Best Practices for Using UML
Keep Diagrams Simple and Focused
Don’t try to include everything in one diagram. Each diagram should tell one story or represent one aspect of the system. If a diagram becomes too complex, break it into multiple diagrams.
Use Consistent Naming Conventions
Maintain consistent naming across all diagrams. If you call something “UserAccount” in one diagram, don’t call it “Account” or “User” in another. This consistency helps stakeholders understand the system better.
Choose the Right Diagram for the Job
Not every situation requires UML. Use diagrams when they add value, such as:
- Communicating complex ideas to teams
- Documenting important architectural decisions
- Planning before implementation
- Onboarding new team members
Avoid creating diagrams just for the sake of documentation if they won’t be maintained or referenced.
Keep Diagrams Updated
UML diagrams lose value quickly if they become outdated. Treat them as living documentation that evolves with your codebase. Consider using tools that can generate diagrams from code to reduce maintenance burden.
Use Appropriate Detail Levels
Different audiences need different levels of detail:
- High-level diagrams for executives and project managers
- Medium-level diagrams for architects and technical leads
- Detailed diagrams for developers implementing specific features
Combine UML with Other Documentation
UML diagrams work best when combined with written documentation, code comments, and example scenarios. They should complement, not replace, other forms of documentation.
Common UML Mistakes to Avoid
Over-Engineering with UML
Creating excessive diagrams for simple projects wastes time. Use UML where complexity justifies the effort, not as a checkbox exercise.
Mixing Abstraction Levels
Don’t mix high-level architecture with low-level implementation details in the same diagram. Keep abstraction levels consistent within each diagram.
Ignoring the Audience
Technical diagrams shown to business stakeholders or oversimplified diagrams given to developers both fail to communicate effectively. Tailor your diagrams to your audience.
Creating Diagrams in Isolation
UML diagrams should reflect team discussions and decisions, not individual assumptions. Collaborate when creating important diagrams to ensure shared understanding.
Forgetting to Validate
Don’t assume your diagrams are correct. Review them with team members, test them against requirements, and validate that they accurately represent the intended design.
UML Tools and Resources
Popular UML Modeling Tools
Many solutions exist on the market, however I will limit my list to the two following tools I like. You can use them for free:
- draw.io – Free online diagramming tool with UML support
- PlantUML – Text-based UML tool that generates diagrams from code
Conclusion
UML provides a powerful, standardized way to visualize and communicate software design. While you don’t need to master all 14 diagram types, understanding the core diagrams – class, sequence, use case, and activity diagrams – will significantly improve your ability to design and document software systems.
The key to effective UML usage is balance. Use diagrams where they add value, keep them simple and focused, and maintain them as living documentation. UML is a tool to support your development process, not a goal in itself.
Start with the diagram types that are most relevant to your current project, practice creating them for real scenarios, and gradually expand your UML skills as needed. With consistent practice, UML will become a natural part of your software design workflow.